
Navigation Timeline
Review every page visited, time on page, device, locale, load time and scroll depth in chronological order.
See where visitors come from, which URLs attract attention, and where they spend time. Replay sessions, visualize heatmaps and UTM sources, then connect behavior to feedback and support conversations.
Availability and data limits vary by plan.
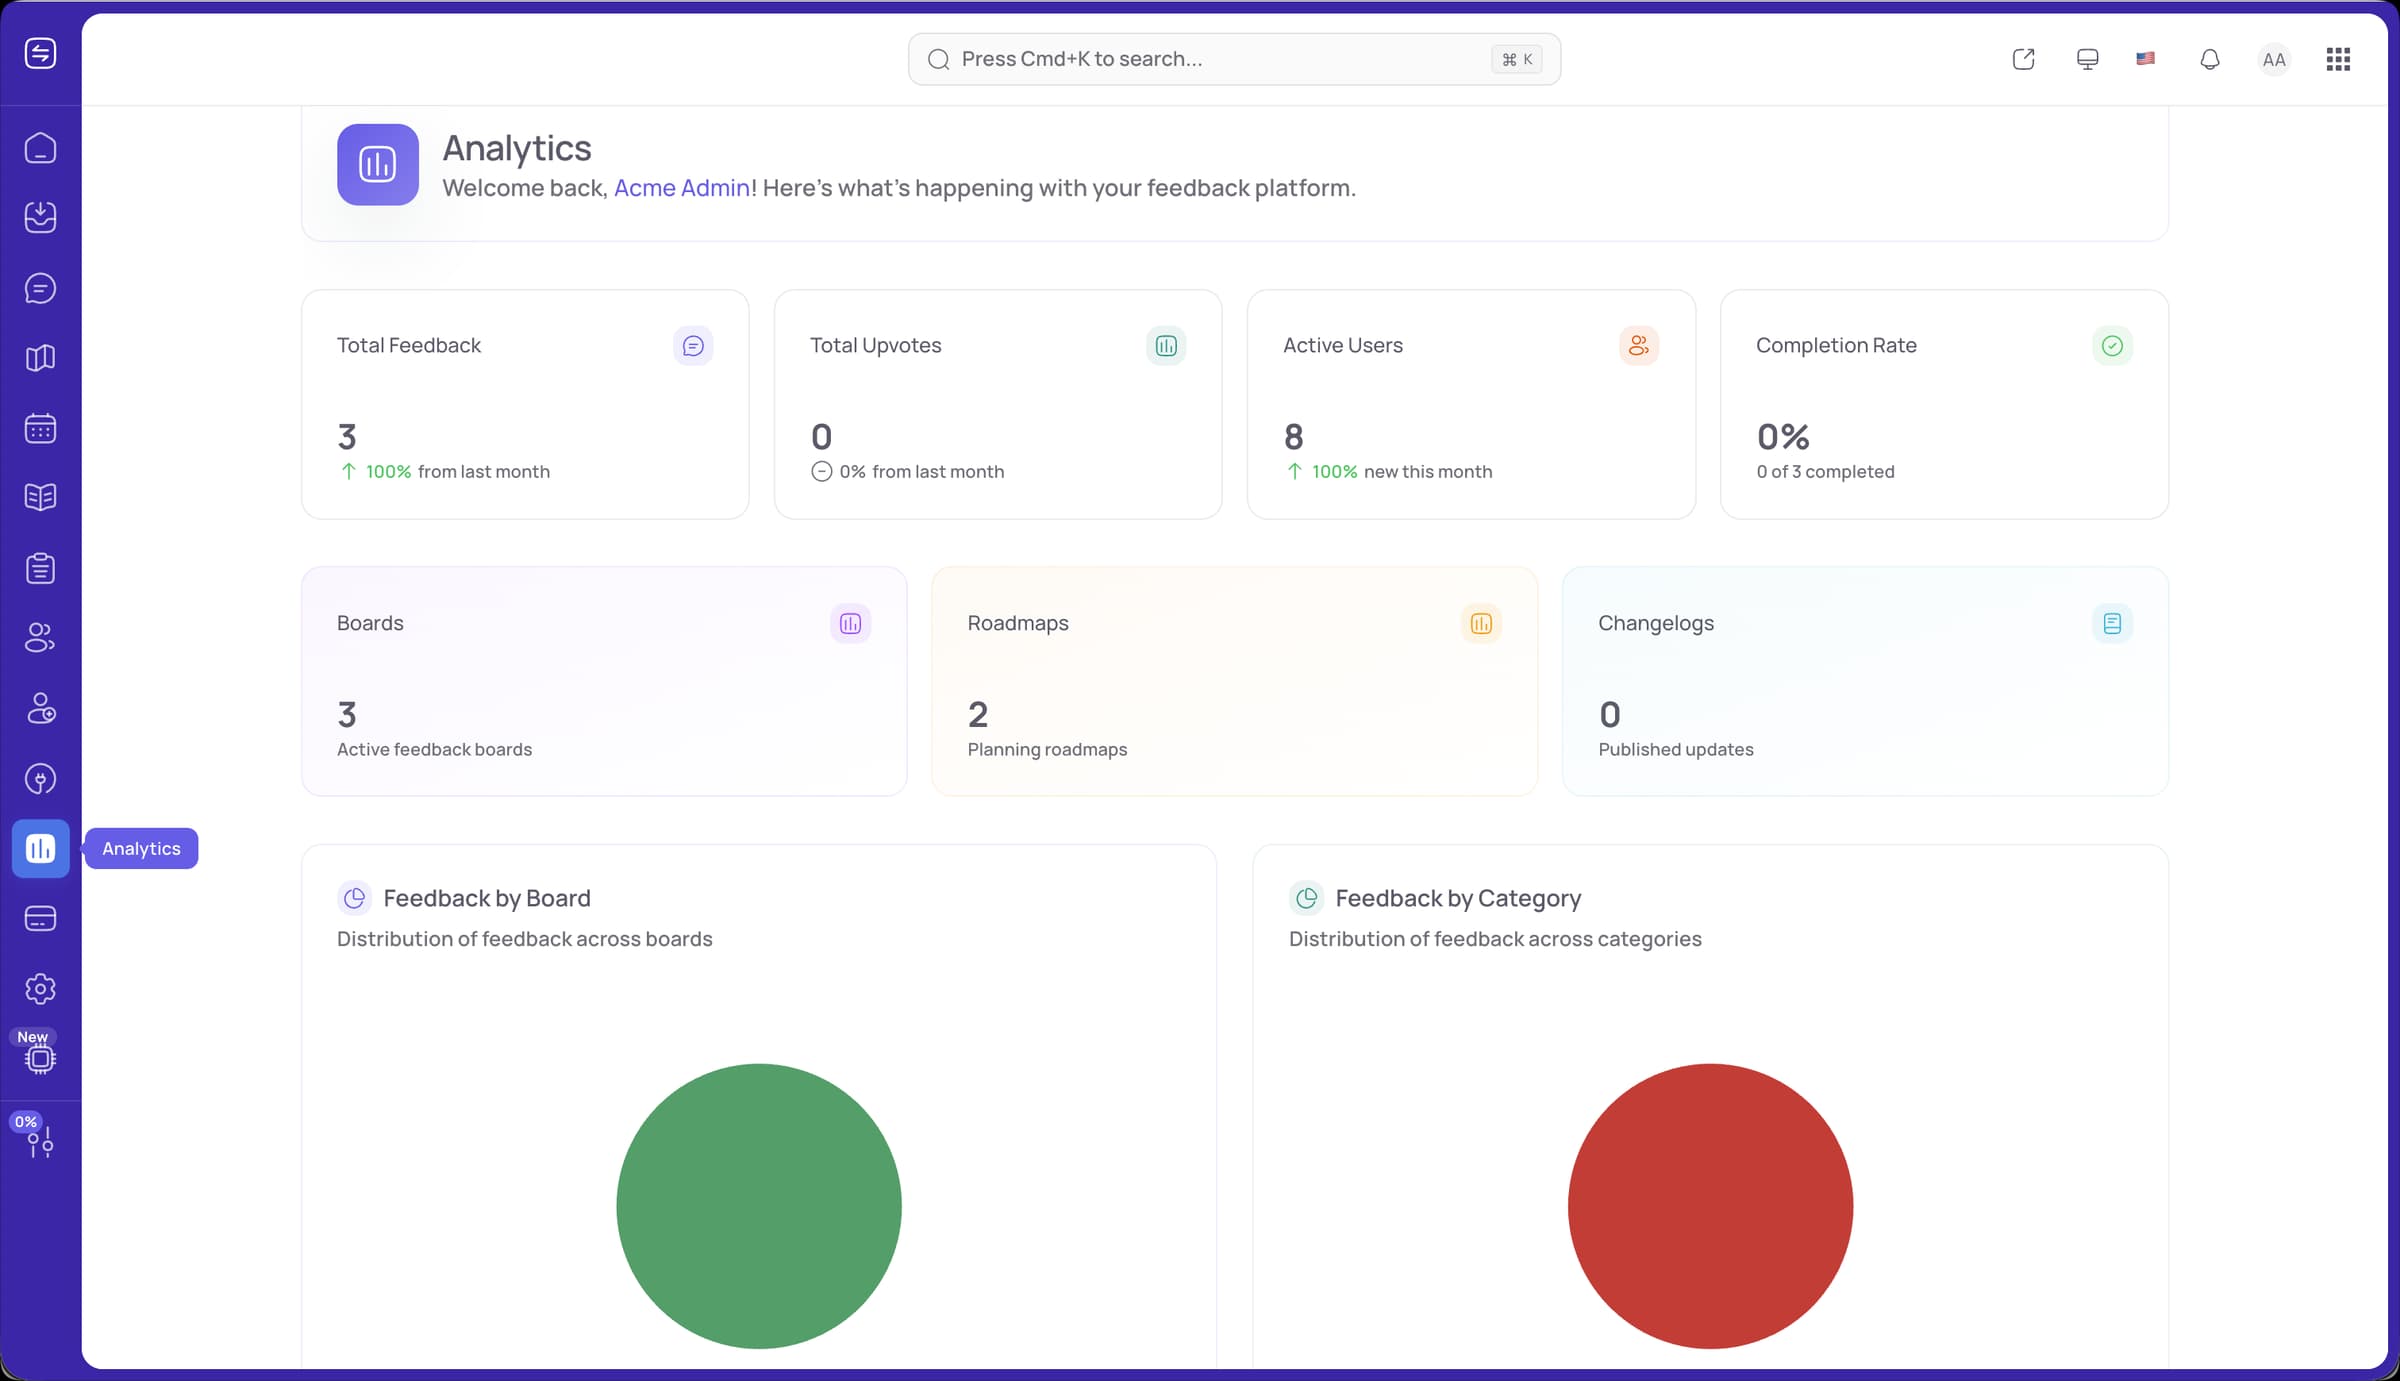
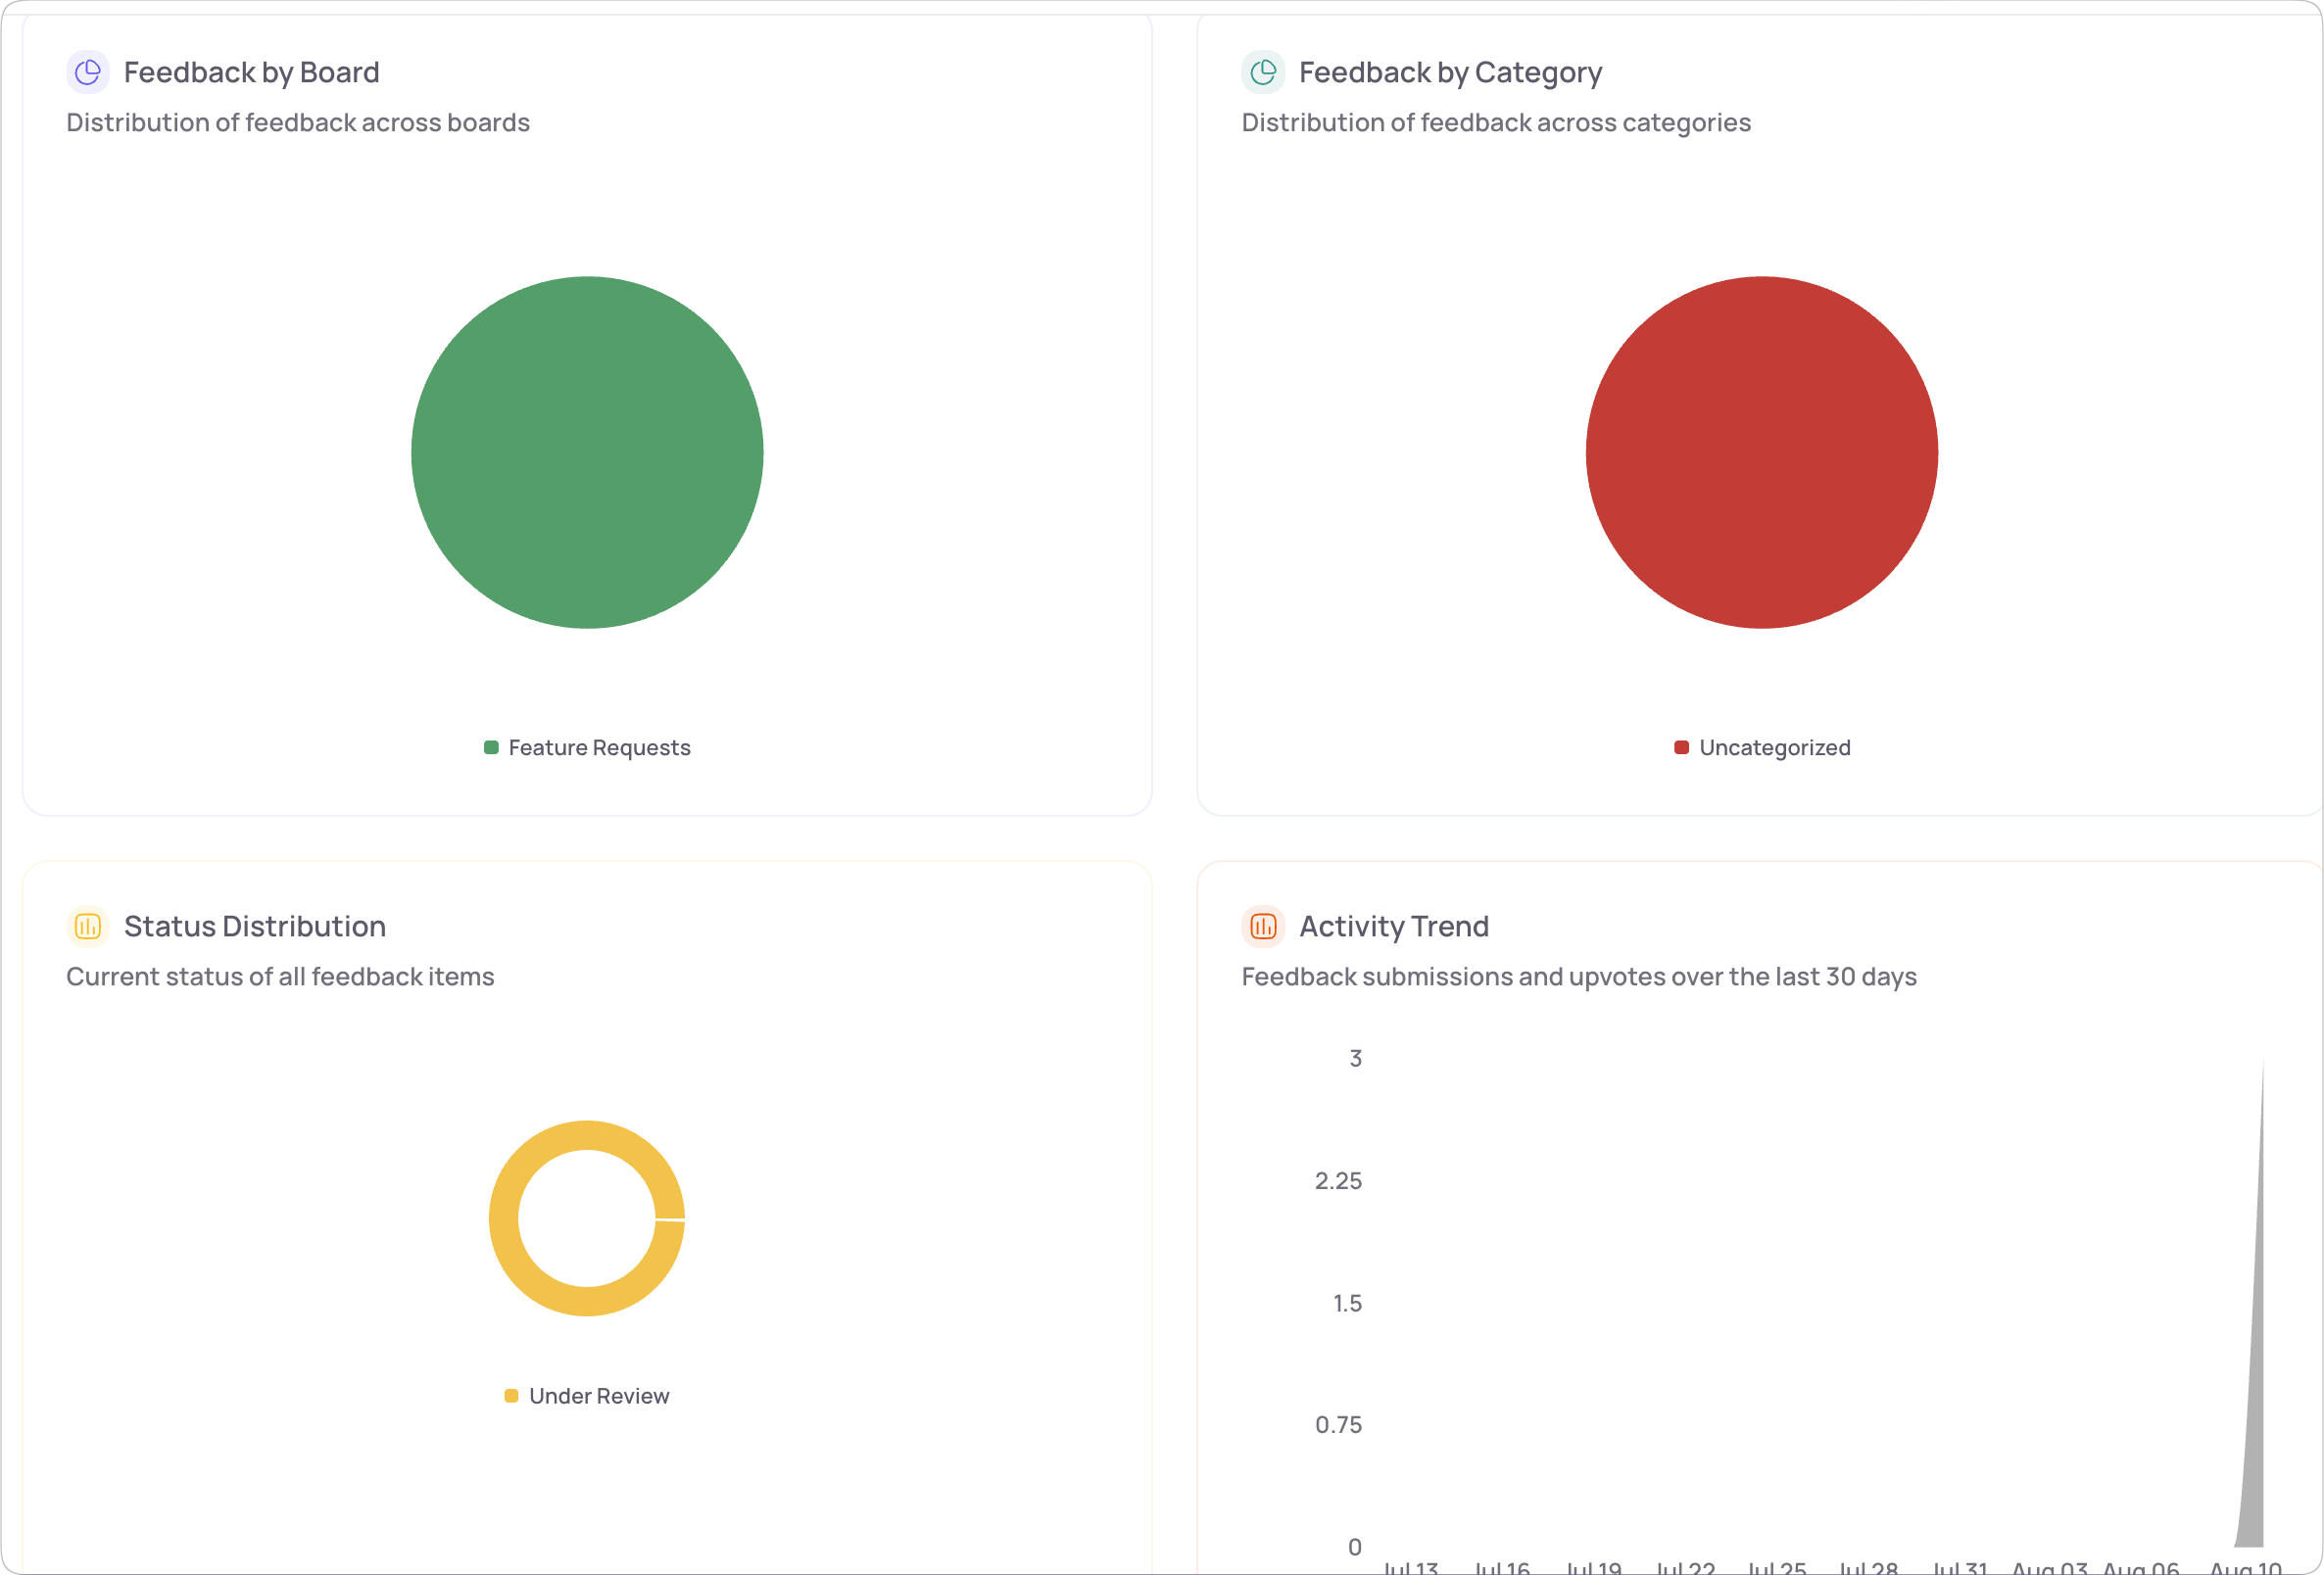
Track traffic and engagement across your product.
From traffic to attention
Move beyond a page-view total. Compare regions, URLs, time spent and campaign sources from one product analytics dashboard.
Traffic by country and region
Most-visited URLs
Pages with the highest time spent
UTM source and campaign visualization
Individual visitor context
Open any visitor to see their complete journey, the sessions behind it and the support conversations that followed.
Review every page visited, time on page, device, locale, load time and scroll depth in chronological order.
Replay the customer journey to see where attention, confusion or friction appeared. Sensitive fields stay masked in the replay.
See what the visitor did before they asked for help, then keep that journey attached to the support conversation and product context.
Behavior at a glance
Generate heatmaps for the URLs that matter. Visualize interaction patterns and scroll behavior before changing a page or product flow.
One connected loop
Use regions, URLs, time spent, UTMs and heatmaps to see where an opportunity or problem is growing.
Move into a visitor timeline, session replay and conversation to understand why it happened.
Turn the evidence into support follow-up, feedback, roadmap decisions and clearer releases.
Sensitive fields are masked in session replays so teams can investigate behavior without displaying private form values.
FAQ
Each visitor profile brings together a chronological Navigation Timeline, Session Replay, Conversations, device and location context, page visits and total time.
Yes. You can compare URLs by visits and see where visitors spend the most time.
Yes. UTM source and campaign data can be visualized alongside product traffic and visitor journeys.
Sensitive fields are masked in session replays.
Product Analytics availability and data limits vary by plan. Compare the current plans to choose the right workspace.
Behavior meets customer voice
Bring analytics, replay, feedback, support and product decisions into one workspace.
Availability and data limits vary by plan.